The Scientist and Engineer's Guide to
Digital Signal Processing
By Steven W. Smith, Ph.D.
Book Search
Table of contents
- 1: The Breadth and Depth of DSP
- 2: Statistics, Probability and Noise
- 3: ADC and DAC
- 4: DSP Software
- 5: Linear Systems
- 6: Convolution
- 7: Properties of Convolution
- 8: The Discrete Fourier Transform
- 9: Applications of the DFT
- 10: Fourier Transform Properties
- 11: Fourier Transform Pairs
- 12: The Fast Fourier Transform
- 13: Continuous Signal Processing
- 14: Introduction to Digital Filters
- 15: Moving Average Filters
- 16: Windowed-Sinc Filters
- 17: Custom Filters
- 18: FFT Convolution
- 19: Recursive Filters
- 20: Chebyshev Filters
- 21: Filter Comparison
- 22: Audio Processing
- 23: Image Formation & Display
- 24: Linear Image Processing
- 25: Special Imaging Techniques
- 26: Neural Networks (and more!)
- 27: Data Compression
- 28: Digital Signal Processors
- 29: Getting Started with DSPs
- 30: Complex Numbers
- 31: The Complex Fourier Transform
- 32: The Laplace Transform
- 33: The z-Transform
- 34: Explaining Benford's Law
How to order your own hardcover copy
Wouldn't you rather have a bound book instead of 640 loose pages?Your laser printer will thank you!
Order from Amazon.com.
Chapter 22: Audio Processing
The perception of a continuous sound, such as a note from a musical instrument, is often divided into three parts: loudness, pitch, and timbre (pronounced "timber"). Loudness is a measure of sound wave intensity, as previously described. Pitch is the frequency of the fundamental component in the sound, that is, the frequency with which the waveform repeats itself. While there are subtle effects in both these perceptions, they are a straightforward match with easily characterized physical quantities.
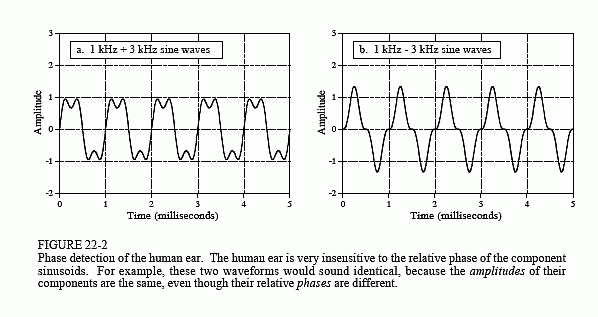
Timbre is more complicated, being determined by the harmonic content of the signal. Figure 22-2 illustrates two waveforms, each formed by adding a 1 kHz sine wave with an amplitude of one, to a 3 kHz sine wave with an amplitude of one-half. The difference between the two waveforms is that the one shown in (b) has the higher frequency inverted before the addition. Put another way, the third harmonic (3 kHz) is phase shifted by 180 degrees compared to the first harmonic (1 kHz). In spite of the very different time domain waveforms, these two signals sound identical. This is because hearing is based on the amplitude of the frequencies, and is very insensitive to their phase. The shape of the time domain waveform is only indirectly related to hearing, and usually not considered in audio systems.

The ear's insensitivity to phase can be understood by examining how sound propagates through the environment. Suppose you are listening to a person speaking across a small room. Much of the sound reaching your ears is reflected from the walls, ceiling and floor. Since sound propagation depends on frequency (such as: attenuation, reflection, and resonance), different frequencies will reach your ear through different paths. This means that the relative phase of each frequency will change as you move about the room. Since the ear disregards these phase variations, you perceive the voice as unchanging as you move position. From a physics standpoint, the phase of an audio signal becomes randomized as it propagates through a complex environment. Put another way, the ear is insensitive to phase because it contains little useful information.
However, it cannot be said that the ear is completely deaf to the phase. This is because a phase change can rearrange the time sequence of an audio signal. An example is the chirp system (Chapter 11) that changes an impulse into a much longer duration signal. Although they differ only in their phase, the ear can distinguish between the two sounds because of their difference in duration. For the most part, this is just a curiosity, not something that happens in the normal listening environment.
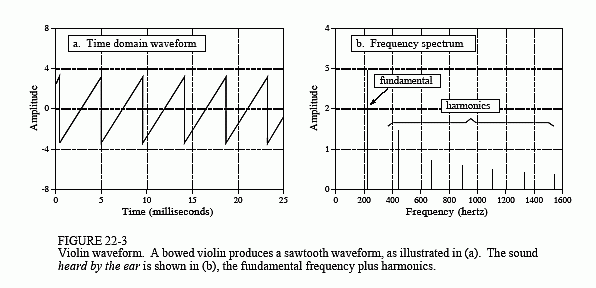
Suppose that we ask a violinist to play a note, say, the A below middle C. When the waveform is displayed on an oscilloscope, it appear much as the sawtooth shown in Fig. 22-3a. This is a result of the sticky rosin applied to the fibers of the violinist's bow. As the bow is drawn across the string, the waveform is formed as the string sticks to the bow, is pulled back, and eventually breaks free. This cycle repeats itself over and over resulting in the sawtooth waveform.
Figure 22-3b shows how this sound is perceived by the ear, a frequency of 220 hertz, plus harmonics at 440, 660, 880 hertz, etc. If this note were played on another instrument, the waveform would look different; however, the ear would still hear a frequency of 220 hertz plus the harmonics. Since the two instruments produce the same fundamental frequency for this note, they sound similar, and are said to have identical pitch. Since the relative amplitude of the harmonics is different, they will not sound identical, and will be said to have different timbre.
It is often said that timbre is determined by the shape of the waveform. This is true, but slightly misleading. The perception of timbre results from the ear detecting harmonics. While harmonic content is determined by the shape of the waveform, the insensitivity of the ear to phase makes the relationship very one-sided. That is, a particular waveform will have only one timbre, while a particular timbre has an infinite number of possible waveforms.
The ear is very accustomed to hearing a fundamental plus harmonics. If a listener is presented with the combination of a 1 kHz and 3 kHz sine wave, they will report that it sounds natural and pleasant. If sine waves of 1 kHz and 3.1 kHz are used, it will sound objectionable.

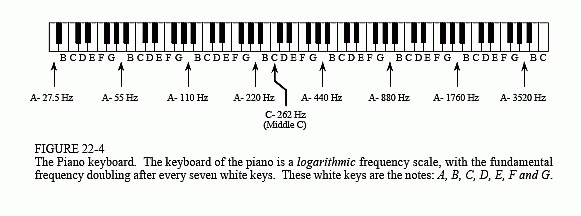
This is the basis of the standard musical scale, as illustrated by the piano keyboard in Fig. 22-4. Striking the farthest left key on the piano produces a fundamental frequency of 27.5 hertz, plus harmonics at 55, 110, 220, 440, 880 hertz, etc. (there are also harmonics between these frequencies, but they aren't important for this discussion). These harmonics correspond to the fundamental frequency produced by other keys on the keyboard. Specifically, every seventh white key is a harmonic of the far left key. That is, the eighth key from the left has a fundamental frequency of 55 hertz, the 15th key has a fundamental frequency of 110 hertz, etc. Being harmonics of each other, these keys sound similar when played, and are harmonious when played in unison. For this reason, they are all called the note, A. In this same manner, the white key immediate right of each A is called a B, and they are all harmonics of each other. This pattern repeats for the seven notes: A, B, C, D, E, F, and G.
The term octave means a factor of two in frequency. On the piano, one octave comprises eight white keys, accounting for the name (octo is Latin for eight). In other words, the pianoís frequency doubles after every seven white keys, and the entire keyboard spans a little over seven octaves. The range of human hearing is generally quoted as 20 hertz to 20 kHz,

corresponding to about 1/2 octave to the left, and two octaves to the right of the piano keyboard. Since octaves are based on doubling the frequency every fixed number of keys, they are a logarithmic representation of frequency. This is important because audio information is generally distributed in this same way. For example, as much audio information is carried in the octave between 50 hertz and 100 hertz, as in the octave between 10 kHz and 20 kHz. Even though the piano only covers about 20% of the frequencies that humans can hear (4 kHz out of 20 kHz), it can produce more than 70% of the audio information that humans can perceive (7 out of 10 octaves). Likewise, the highest frequency a human can detect drops from about 20 kHz to 10 kHz over the course of an adult's lifetime. However, this is only a loss of about 10% of the hearing ability (one octave out of ten). As shown next, this logarithmic distribution of information directly affects the required sampling rate of audio signals.
