The Scientist and Engineer's Guide to
Digital Signal Processing
By Steven W. Smith, Ph.D.
Book Search
Table of contents
- 1: The Breadth and Depth of DSP
- 2: Statistics, Probability and Noise
- 3: ADC and DAC
- 4: DSP Software
- 5: Linear Systems
- 6: Convolution
- 7: Properties of Convolution
- 8: The Discrete Fourier Transform
- 9: Applications of the DFT
- 10: Fourier Transform Properties
- 11: Fourier Transform Pairs
- 12: The Fast Fourier Transform
- 13: Continuous Signal Processing
- 14: Introduction to Digital Filters
- 15: Moving Average Filters
- 16: Windowed-Sinc Filters
- 17: Custom Filters
- 18: FFT Convolution
- 19: Recursive Filters
- 20: Chebyshev Filters
- 21: Filter Comparison
- 22: Audio Processing
- 23: Image Formation & Display
- 24: Linear Image Processing
- 25: Special Imaging Techniques
- 26: Neural Networks (and more!)
- 27: Data Compression
- 28: Digital Signal Processors
- 29: Getting Started with DSPs
- 30: Complex Numbers
- 31: The Complex Fourier Transform
- 32: The Laplace Transform
- 33: The z-Transform
- 34: Explaining Benford's Law
How to order your own hardcover copy
Wouldn't you rather have a bound book instead of 640 loose pages?Your laser printer will thank you!
Order from Amazon.com.
Chapter 24: Linear Image Processing
Fourier analysis is used in image processing in much the same way as with one-dimensional signals. However, images do not have their information encoded in the frequency domain, making the techniques much less useful. For example, when the Fourier transform is taken of an audio signal, the confusing time domain waveform is converted into an easy to understand frequency spectrum. In comparison, taking the Fourier transform of an image converts the straightforward information in the spatial domain into a scrambled form in the frequency domain. In short, don't expect the Fourier transform to help you understand the information encoded in images.
Likewise, don't look to the frequency domain for filter design. The basic feature in images is the edge, the line separating one object or region from another object or region. Since an edge is composed of a wide range of frequency components, trying to modify an image by manipulating the frequency spectrum is generally not productive. Image filters are normally designed in the spatial domain, where the information is encoded in its simplest form. Think in terms of smoothing and edge enhancement operations (the spatial domain) rather than high-pass and low-pass filters (the frequency domain).
In spite of this, Fourier image analysis does have several useful properties. For instance, convolution in the spatial domain corresponds to multiplication in the frequency domain. This is important because multiplication is a simpler mathematical operation than convolution. As with one-dimensional signals, this property enables FFT convolution and various deconvolution techniques. Another useful property of the frequency domain is the Fourier Slice Theorem, the relationship between an image and its projections (the image viewed from its sides). This is the basis of computed tomography, an x-ray imaging technique widely used medicine and industry.
The frequency spectrum of an image can be calculated in several ways, but the FFT method presented here is the only one that is practical. The original image must be composed of N rows by N columns, where N is a power of two, i.e., 256, 512, 1024, etc. If the size of the original image is not a power of two, pixels with a value of zero are added to make it the correct size. We will call the two-dimensional array that holds the image the real array. In addition, another array of the same size is needed, which we will call the imaginary array.
The recipe for calculating the Fourier transform of an image is quite simple: take the one-dimensional FFT of each of the rows, followed by the one-dimensional FFT of each of the columns. Specifically, start by taking the FFT of the N pixel values in row 0 of the real array. The real part of the FFT's output is placed back into row 0 of the real array, while the imaginary part of the FFT's output is placed into row 0 of the imaginary array. After repeating this procedure on rows 1 through N-1, both the real and imaginary arrays contain an intermediate image. Next, the procedure is repeated on each of the columns of the intermediate data. Take the N pixel values from column 0 of the real array, and the N pixel values from column 0 of the imaginary array, and calculate the FFT. The real part of the FFT's output is placed back into column 0 of the real array, while the imaginary part of the FFT's output is placed back into column 0 of the imaginary array. After this is repeated on columns 1 through N-1, both arrays have been overwritten with the image's frequency spectrum.
Since the vertical and horizontal directions are equivalent in an image, this algorithm can also be carried out by transforming the columns first and then transforming the rows. Regardless of the order used, the result is the same. From the way that the FFT keeps track of the data, the amplitudes of the low frequency components end up being at the corners of the two-dimensional spectrum, while the high frequencies are at the center. The inverse Fourier transform of an image is calculated by taking the inverse FFT of each row, followed by the inverse FFT of each column (or vice versa).
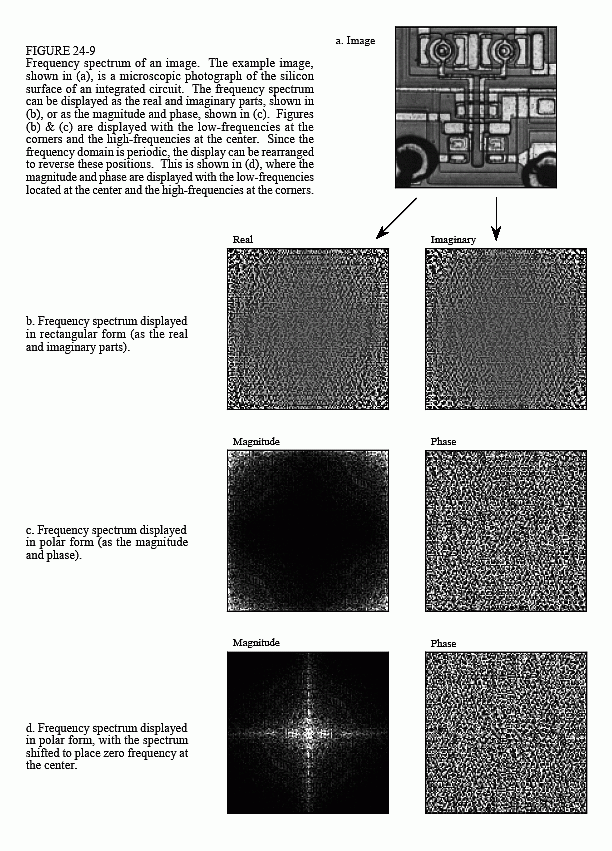
Figure 24-9 shows an example Fourier transform of an image. Figure (a) is the original image, a microscopic view of the input stage of a 741 op amp integrated circuit. Figure (b) shows the real and imaginary parts of the frequency spectrum of this image. Since the frequency domain can contain negative pixel values, the grayscale values of these images are offset such that negative values are dark, zero is gray, and positive values are light. The low-frequency components in an image are normally much larger in amplitude than the high-frequency components. This accounts for the very bright and dark pixels at the four corners of (b). Other than this, the spectra of typical images have no discernable order, appearing random. Of course, images can be contrived to have any spectrum you desire.
As shown in (c), the polar form of an image spectrum is only slightly easier to understand. The low-frequencies in the magnitude have large positive values (the white corners), while the high-frequencies have small positive values (the black center). The phase looks the same at low and high-frequencies, appearing to run randomly between -π and π radians.
Figure (d) shows an alternative way of displaying an image spectrum. Since the spatial domain contains a discrete signal, the frequency domain is periodic. In other words, the frequency domain arrays are duplicated an infinite number of times to the left, right, top and bottom. For instance, imagine a tile wall, with each tile being the N×N magnitude shown in (c). Figure (d) is also an N×N section of this tile wall, but it straddles four tiles; the center of the image being where the four tiles touch. In other words, (c) is the same image as (d), except it has been shifted N/2 pixels horizontally (either left or right) and N/2 pixels vertically (either up or down) in the periodic frequency spectrum. This brings the bright pixels at the four corners of (c) together in the center of (d).
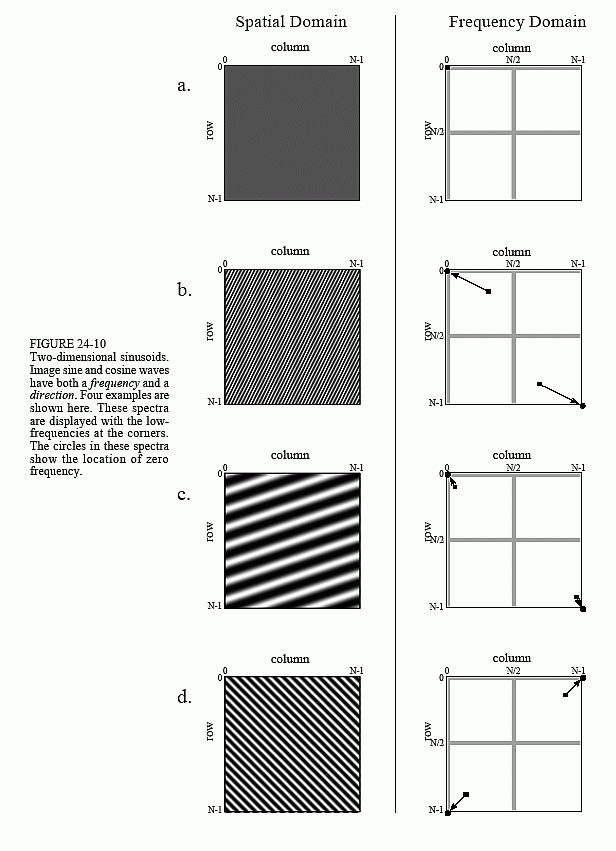
Figure 24-10 illustrates how the two-dimensional frequency domain is organized (with the low-frequencies placed at the corners). Row N/2 and column N/2 break the frequency spectrum into four quadrants. For the real part and the magnitude, the upper-right quadrant is a mirror image of the lower-left, while the upper-left is a mirror image of the lower-right. This symmetry also holds for the imaginary part and the phase, except that the values of the mirrored pixels are opposite in sign. In other words, every point in the frequency spectrum has a matching point placed symmetrically on the other side of the center of the image (row N/2 and column N/2). One of the points is the positive frequency, while the other is the matching

negative frequency, as discussed in Chapter 10 for one-dimensional signals. In equation form, this symmetry is expressed as:

These equations take into account that the frequency spectrum is periodic, repeating itself every N samples with indexes running from 0 to N-1. In other words, X[r,N] should be interpreted as X[r,0], X[N,c] as X[0,c], and X[N,N] as X[0,0]. This symmetry makes four points in the spectrum match with themselves. These points are located at: [0,0], [0,N/2], [N/2,0] and [N/2,N/2].
Each pair of points in the frequency domain corresponds to a sinusoid in the spatial domain. As shown in (a), the value at corresponds to the zero frequency sinusoid in the spatial domain, i.e., the DC component of the image. There is only one point shown in this figure, because this is one of the points that is its own match. As shown in (b), (c), and (d), other pairs of points correspond to two-dimensional sinusoids that look like waves on the ocean. One-dimensional sinusoids have a frequency, phase, and amplitude. Two dimensional sinusoids also have a direction.
The frequency and direction of each sinusoid is determined by the location of the pair of points in the frequency domain. As shown, draw a line from each point to the zero frequency location at the outside corner of the quadrant that the point is in, i.e., [0,0], [0,N/2], [N/2,0] and [N/2,N/2] (as indicated by the circles in this figure). The direction of this line determines the direction of the spatial sinusoid, while its length is proportional to the frequency of the wave. This results in the low frequencies being positioned near the corners, and the high frequencies near the center.
When the spectrum is displayed with zero frequency at the center ( Fig. 24-9d), the line from each pair of points is drawn to the DC value at the center of the image, i.e., [N/2,N/2]. This organization is simpler to understand and work with, since all the lines are drawn to the same point. Another advantage of placing zero at the center is that it matches the frequency spectra of continuous images. When the spatial domain is continuous, the frequency domain is aperiodic. This places zero frequency at the center, with the frequency becoming higher in all directions out to infinity. In general, the frequency spectra of discrete images are displayed with zero frequency at the center whenever people will view the data, in textbooks, journal articles, and algorithm documentation. However, most calculations are carried out with the computer arrays storing data in the other format (low-frequencies at the corners). This is because the FFT has this format.

Even with the FFT, the time required to calculate the Fourier transform is a tremendous bottleneck in image processing. For example, the Fourier transform of a 512×512 image requires several minutes on a personal computer. This is roughly 10,000 times slower than needed for real time image processing, 30 frames per second. This long execution time results from the massive amount of information contained in images. For comparison, there are about the same number of pixels in a typical image, as there are words in this book. Image processing via the frequency domain will become more popular as computers become faster. This is a twenty-first century technology; watch it emerge!
