The Scientist and Engineer's Guide to
Digital Signal Processing
By Steven W. Smith, Ph.D.
Book Search
Table of contents
- 1: The Breadth and Depth of DSP
- 2: Statistics, Probability and Noise
- 3: ADC and DAC
- 4: DSP Software
- 5: Linear Systems
- 6: Convolution
- 7: Properties of Convolution
- 8: The Discrete Fourier Transform
- 9: Applications of the DFT
- 10: Fourier Transform Properties
- 11: Fourier Transform Pairs
- 12: The Fast Fourier Transform
- 13: Continuous Signal Processing
- 14: Introduction to Digital Filters
- 15: Moving Average Filters
- 16: Windowed-Sinc Filters
- 17: Custom Filters
- 18: FFT Convolution
- 19: Recursive Filters
- 20: Chebyshev Filters
- 21: Filter Comparison
- 22: Audio Processing
- 23: Image Formation & Display
- 24: Linear Image Processing
- 25: Special Imaging Techniques
- 26: Neural Networks (and more!)
- 27: Data Compression
- 28: Digital Signal Processors
- 29: Getting Started with DSPs
- 30: Complex Numbers
- 31: The Complex Fourier Transform
- 32: The Laplace Transform
- 33: The z-Transform
- 34: Explaining Benford's Law
How to order your own hardcover copy
Wouldn't you rather have a bound book instead of 640 loose pages?Your laser printer will thank you!
Order from Amazon.com.
Chapter 27: Data Compression
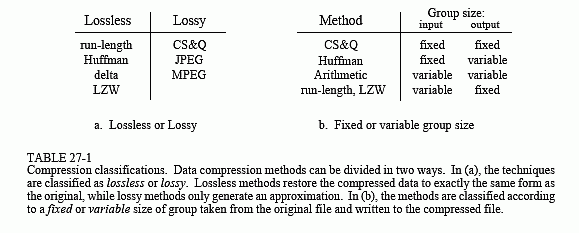
Table 27-1 shows two different ways that data compression algorithms can be categorized. In (a), the methods have been classified as either lossless or lossy. A lossless technique means that the restored data file is identical to the original. This is absolutely necessary for many types of data, for example: executable code, word processing files, tabulated numbers, etc. You cannot afford to misplace even a single bit of this type of information. In comparison, data files that represent images and other acquired signals do not have to be keep in perfect condition for storage or transmission. All real world measurements inherently contain a certain amount of noise. If the changes made to these signals resemble a small amount of additional noise, no harm is done. Compression techniques that allow this type of degradation are called lossy. This distinction is important because lossy techniques are much more effective at compression than lossless methods. The higher the compression ratio, the more noise added to the data.

Images transmitted over the world wide web are an excellent example of why data compression is important. Suppose we need to download a digitized color photograph over a computer's 33.6 kbps modem. If the image is not compressed (a TIFF file, for example), it will contain about 600 kbytes of data. If it has been compressed using a lossless technique (such as used in the GIF format), it will be about one-half this size, or 300 kbytes. If lossy compression has been used (a JPEG file), it will be about 50 kbytes. The point is, the download times for these three equivalent files are 142 seconds, 71 seconds, and 12 seconds, respectively. That's a big difference! JPEG is the best choice for digitized photographs, while GIF is used with drawn images, such as company logos that have large areas of a single color.
Our second way of classifying data compression methods is shown in Table 27-1b. Most data compression programs operate by taking a group of data from the original file, compressing it in some way, and then writing the compressed group to the output file. For instance, one of the techniques in this table is CS&Q, short for coarser sampling and/or quantization. Suppose we are compressing a digitized waveform, such as an audio signal that has been digitized to 12 bits. We might read two adjacent samples from the original file (24 bits), discard one of the sample completely, discard the least significant 4 bits from the other sample, and then write the remaining 8 bits to the output file. With 24 bits in and 8 bits out, we have implemented a 3:1 compression ratio using a lossy algorithm. While this is rather crude in itself, it is very effective when used with a technique called transform compression. As we will discuss later, this is the basis of JPEG.
Table 27-1b shows CS&Q to be a fixed-input fixed-output scheme. That is, a fixed number of bits are read from the input file and a smaller fixed number of bits are written to the output file. Other compression methods allow a variable number of bits to be read or written. As you go through the description of each of these compression methods, refer back to this table to understand how it fits into this classification scheme. Why are JPEG and MPEG not listed in this table? These are composite algorithms that combine many of the other techniques. They are too sophisticated to be classified into these simple categories.
