The Scientist and Engineer's Guide to
Digital Signal Processing
By Steven W. Smith, Ph.D.
Book Search
Table of contents
- 1: The Breadth and Depth of DSP
- 2: Statistics, Probability and Noise
- 3: ADC and DAC
- 4: DSP Software
- 5: Linear Systems
- 6: Convolution
- 7: Properties of Convolution
- 8: The Discrete Fourier Transform
- 9: Applications of the DFT
- 10: Fourier Transform Properties
- 11: Fourier Transform Pairs
- 12: The Fast Fourier Transform
- 13: Continuous Signal Processing
- 14: Introduction to Digital Filters
- 15: Moving Average Filters
- 16: Windowed-Sinc Filters
- 17: Custom Filters
- 18: FFT Convolution
- 19: Recursive Filters
- 20: Chebyshev Filters
- 21: Filter Comparison
- 22: Audio Processing
- 23: Image Formation & Display
- 24: Linear Image Processing
- 25: Special Imaging Techniques
- 26: Neural Networks (and more!)
- 27: Data Compression
- 28: Digital Signal Processors
- 29: Getting Started with DSPs
- 30: Complex Numbers
- 31: The Complex Fourier Transform
- 32: The Laplace Transform
- 33: The z-Transform
- 34: Explaining Benford's Law
How to order your own hardcover copy
Wouldn't you rather have a bound book instead of 640 loose pages?Your laser printer will thank you!
Order from Amazon.com.
Chapter 8: The Discrete Fourier Transform
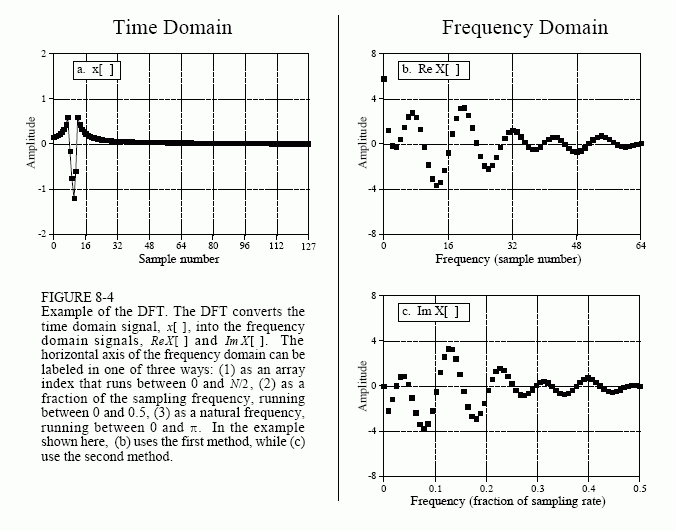
Figure 8-4 shows an example DFT with N = 128. The time domain signal is contained in the array: x[0] to x[127]. The frequency domain signals are contained in the two arrays: ReX[0] to ReX[64], and ImX[0] to ImX[64]. Notice that 128 points in the time domain corresponds to 65 points in each of the frequency domain signals, with the frequency indexes running from 0 to 64. That is, N points in the time domain corresponds to N/2 + 1 points in the frequency domain (not N/2 points). Forgetting about this extra point is a common bug in DFT programs.
The horizontal axis of the frequency domain can be referred to in four different ways, all of which are common in DSP. In the first method, the horizontal axis is labeled from 0 to 64, corresponding to the 0 to N/2 samples in the arrays. When this labeling is used, the index for the frequency domain is an integer, for example, ReX[k] and ImX[k], where k runs from 0 to N/2 in steps of one. Programmers like this method because it is how they write code, using an index to access array locations. This notation is used in Fig. 8-4b.

In the second method, used in (c), the horizontal axis is labeled as a fraction of the sampling rate. This means that the values along the horizonal axis always run between 0 and 0.5, since discrete data can only contain frequencies between DC and one-half the sampling rate. The index used with this notation is f, for frequency. The real and imaginary parts are written: ReX[f] and ImX[f], where f takes on N/2+1 equally spaced values between 0 and 0.5. To convert from the first notation, k, to the second notation, f, divide the horizontal axis by N. That is, f = k/N. Most of the graphs in this book use this second method, reinforcing that discrete signals only contain frequencies between 0 and 0.5 of the sampling rate.
The third style is similar to the second, except the horizontal axis is multiplied by 2π. The index used with this labeling is ω, a lower case Greek omega. In this notation, the real and imaginary parts are written: ReX[ω] and ImX[ω], where ω takes on N/2 + 1 equally spaced values between 0 and π. The parameter, ω, is called the natural frequency, and has the units of radians. This is based on the idea that there are 2π radians in a circle. Mathematicians like this method because it makes the equations shorter. For instance, consider how a cosine wave is written in each of these first three notations: using k: c[n] = cos(2πkn/N), using f: c[n] = cos(2πfn), and using ω: c[n] = cos(ωn).
The fourth method is to label the horizontal axis in terms of the analog frequencies used in a particular application. For instance, if the system being examined has a sampling rate of 10 kHz (i.e., 10,000 samples per second), graphs of the frequency domain would run from 0 to 5 kHz. This method has the advantage of presenting the frequency data in terms of a real world meaning. The disadvantage is that it is tied to a particular sampling rate, and is therefore not applicable to general DSP algorithm development, such as designing digital filters.
All of these four notations are used in DSP, and you need to become comfortable with converting between them. This includes both graphs and mathematical equations. To find which notation is being used, look at the independent variable and its range of values. You should find one of four notations: k (or some other integer index), running from 0 to N/2; f, running from 0 to 0.5; ω, running from 0 to π; or a frequency expressed in hertz, running from DC to one-half of an actual sampling rate.
